Monte Carlo study · mathematical finance

When does estimation error make an “optimal” portfolio worse than dividing by N?

Markowitz optimisation is provably right and routinely useless. This study measures exactly why, in a simulated world where the true μ and Σ are known — so estimation error is measured, not inferred.

The same optimiser handed the true parameters beats equal weighting in 91.7%100% of worlds. Handed estimates, it needs 500 months — 42 years — of monthly data before it wins even half the time.

The result

The theory works. The inputs are what fail.

Every cell below is 1,000 repetitions. Blue means the optimiser beats naive diversification; orange means 1/N wins. The bottom-right panel is the oracle — the identical optimiser given the true μ and Σ. It wins almost everywhere, which is what makes the rest interpretable: optimisation is genuinely worth doing, so every loss elsewhere is caused by estimation error alone rather than by a flaw in the objective.
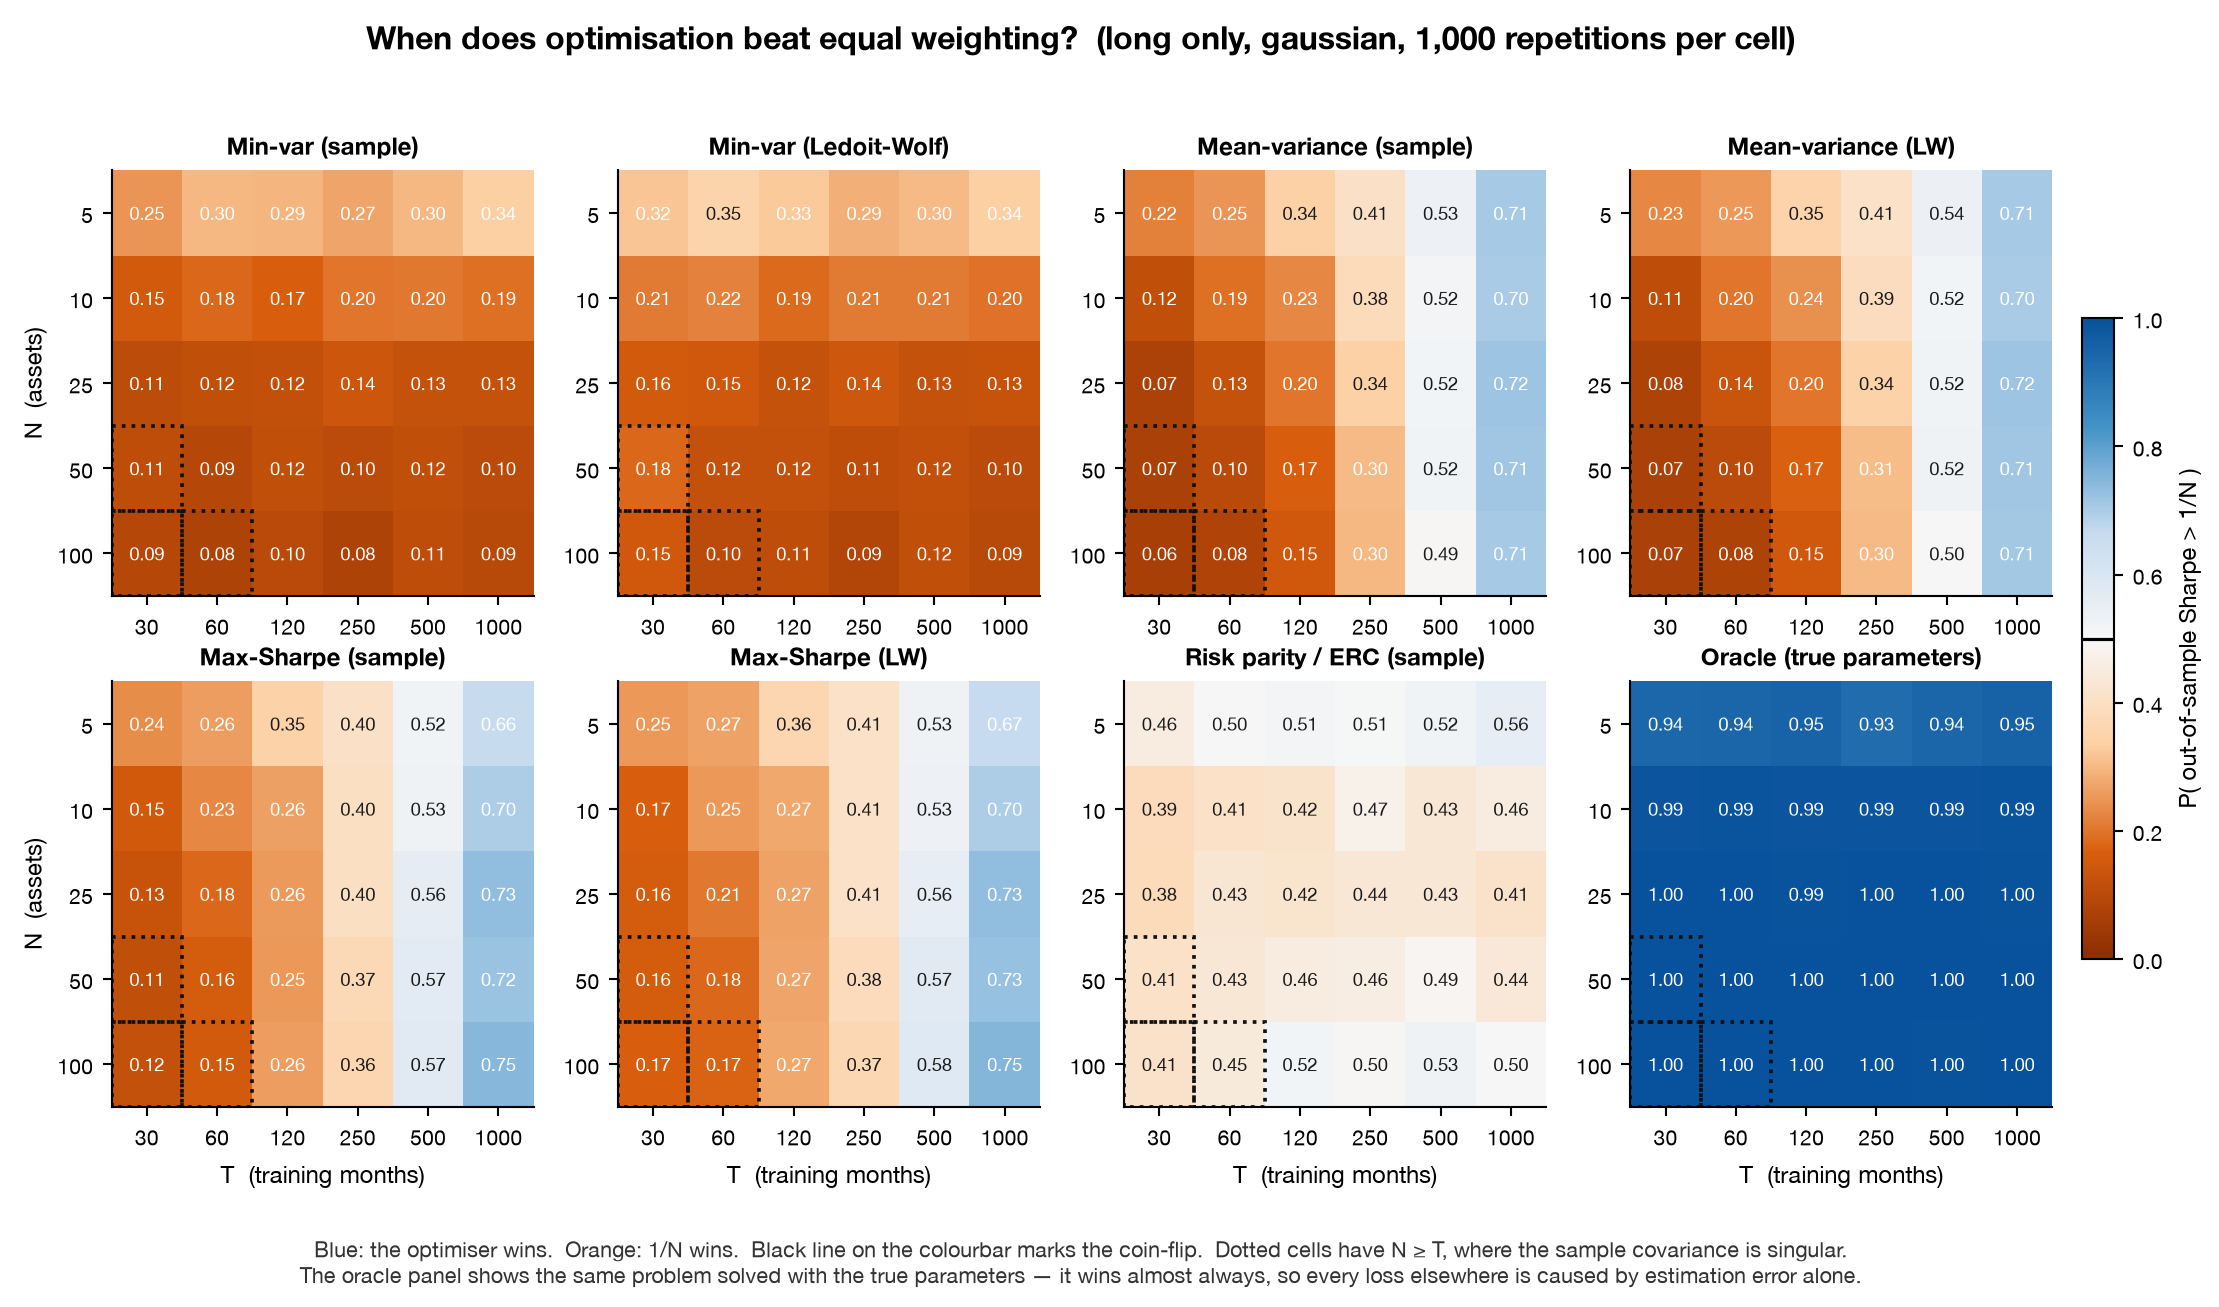
Heatmap grid showing probability of beating equal weighting across N and T for eight portfolio methods
Probability that an optimised portfolio beats 1/N out of sample, over the grid of N assets and T training months. Dotted cells have N ≥ T, where the sample covariance is singular.
MethodT=30T=60T=120T=250T=500T=1000
Mean-variance (sample)0.0630.0790.1470.2970.4940.707
Maximum Sharpe (sample)0.1220.1550.2600.3600.5740.746
Minimum variance (sample)0.0900.0760.0990.0780.1120.094
Risk parity (ERC)0.4120.4490.5180.4960.5310.502
Oracle (true parameters)0.9970.9991.0000.9980.9960.999
P(out-of-sample Sharpe > 1/N) at N = 100, long-only, Gaussian. The oracle row is the same optimiser given the true parameters.

Mean-variance with a sample mean beats 1/N in 6.3% of worlds at N = 100, T = 30, and does not reach even odds until T = 500 months.
Why

Expected returns are unknowable at any realistic sample size

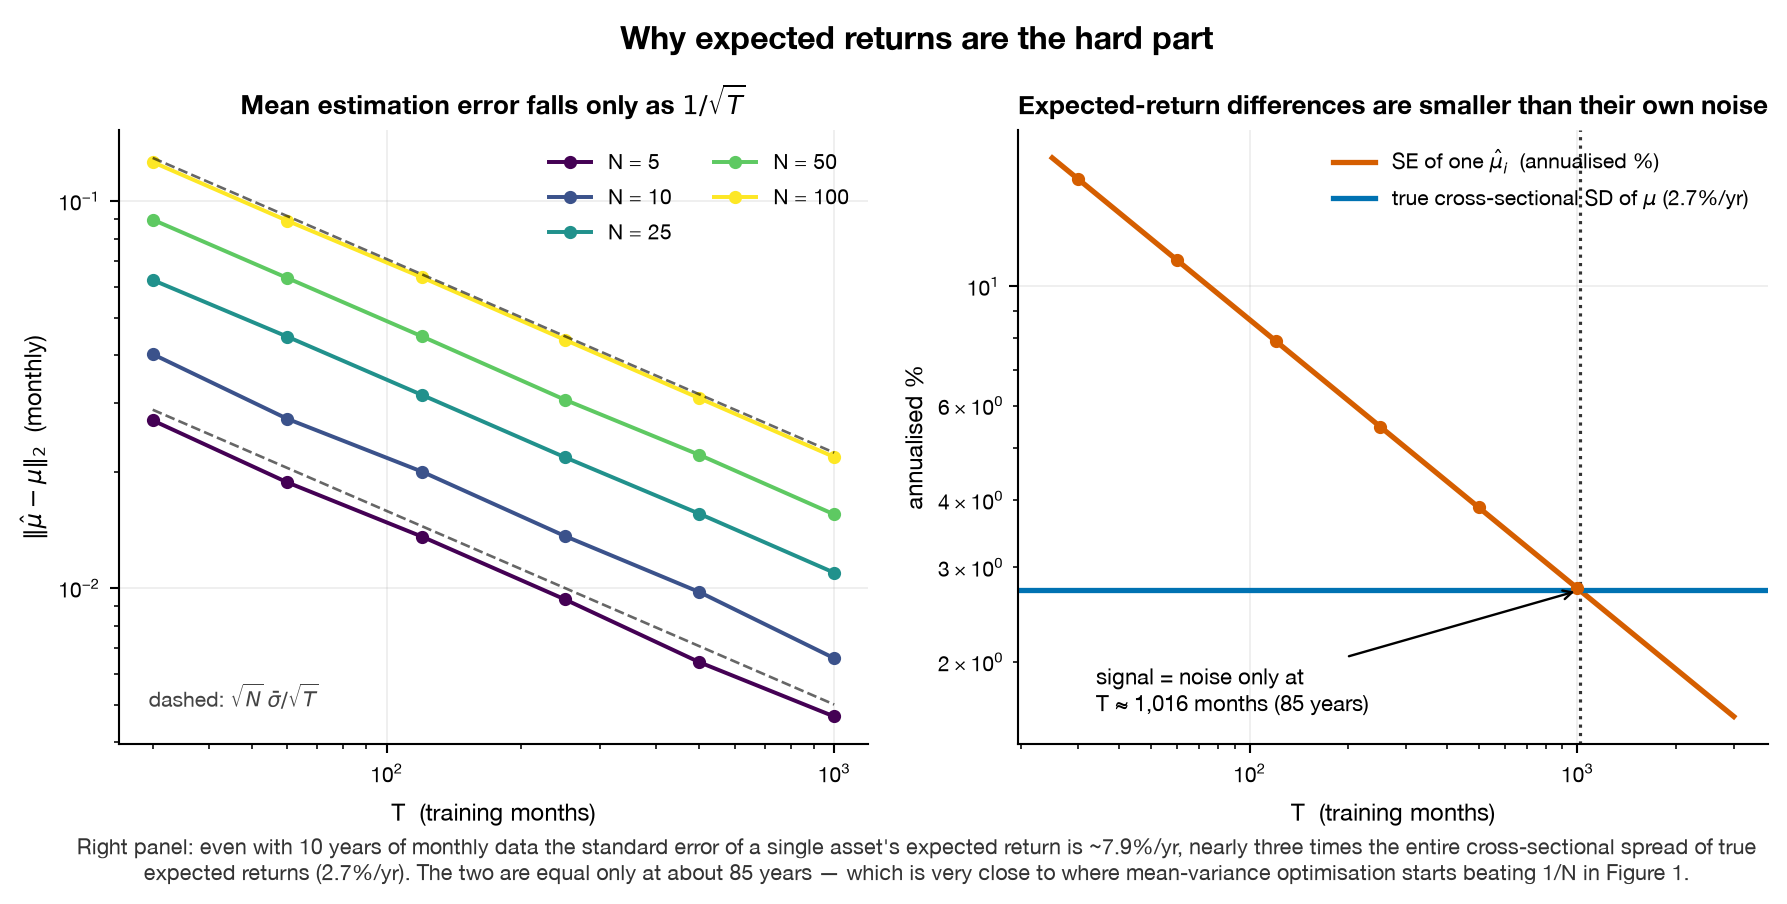
The annualised standard error of one expected return is σ·√(12/T). At T = 120 months that is 7.9% per year, against a cross-sectional spread of true expected returns of just 2.7% per year. Noise exceeds signal until T ≈ 1,015 months — about 85 years — which is almost exactly where mean-variance starts beating 1/N above. The break-even is not a coincidence.

Two panels showing mean estimation error versus T and the signal-to-noise crossover
Left: mean estimation error falls only as 1/√T. Right: the standard error of a single expected return against the entire cross-sectional spread of true expected returns.

The mechanism

Different optimisers fail for different reasons

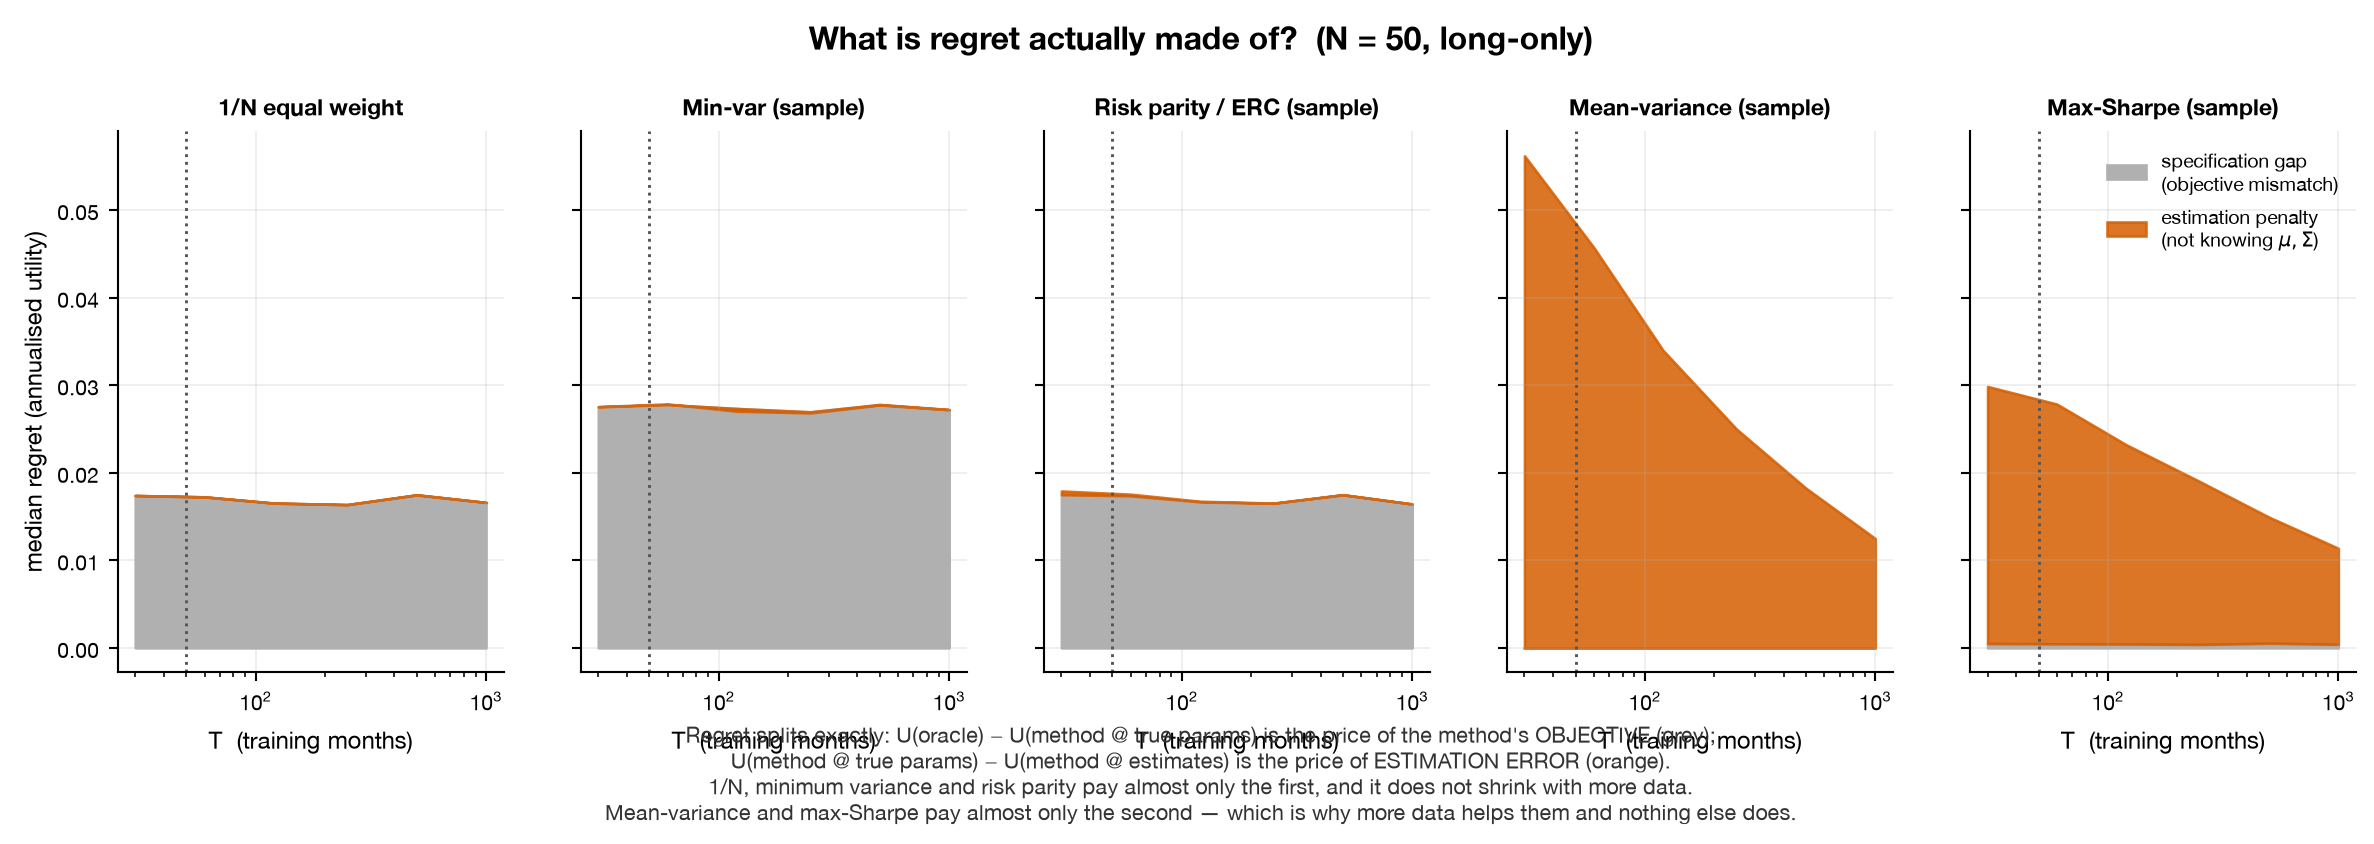
Solving each method a second time with the true parameters splits regret exactly into the price of a wrong objective and the price of wrong inputs:

regret = specification_gap + estimation_penalty
         (wrong objective)   (wrong inputs)

The identity holds to a maximum residual of 0 (5.6e-17) across all 1.32M rows. Mean-variance has a specification gap of exactly 0 — it is the oracle’s objective — so 100% of its regret is estimation error. Minimum variance is the mirror image: 100% of its shortfall is the price of ignoring μ, and essentially none is estimation error. The two sit next to each other on a league table and need opposite fixes.

MethodRegretSpecification gapEstimation penalty% estimation
1/N equal weight0.01740.01740.00000%
Minimum variance0.02730.02750.00000%
Risk parity (ERC)0.01780.01750.00042%
Mean-variance0.05620.00000.0562100%
Maximum Sharpe0.03000.00050.029498%
Median regret decomposed, N = 50, T = 30, long-only. The identity holds to 5.6e-17 across all 1.32M rows.
Stacked area charts decomposing regret for five portfolio methods
Regret split into objective mismatch (grey) and estimation error (orange). More data shrinks the orange and does nothing to the grey.

Regularisation

Constraints matter more than estimators

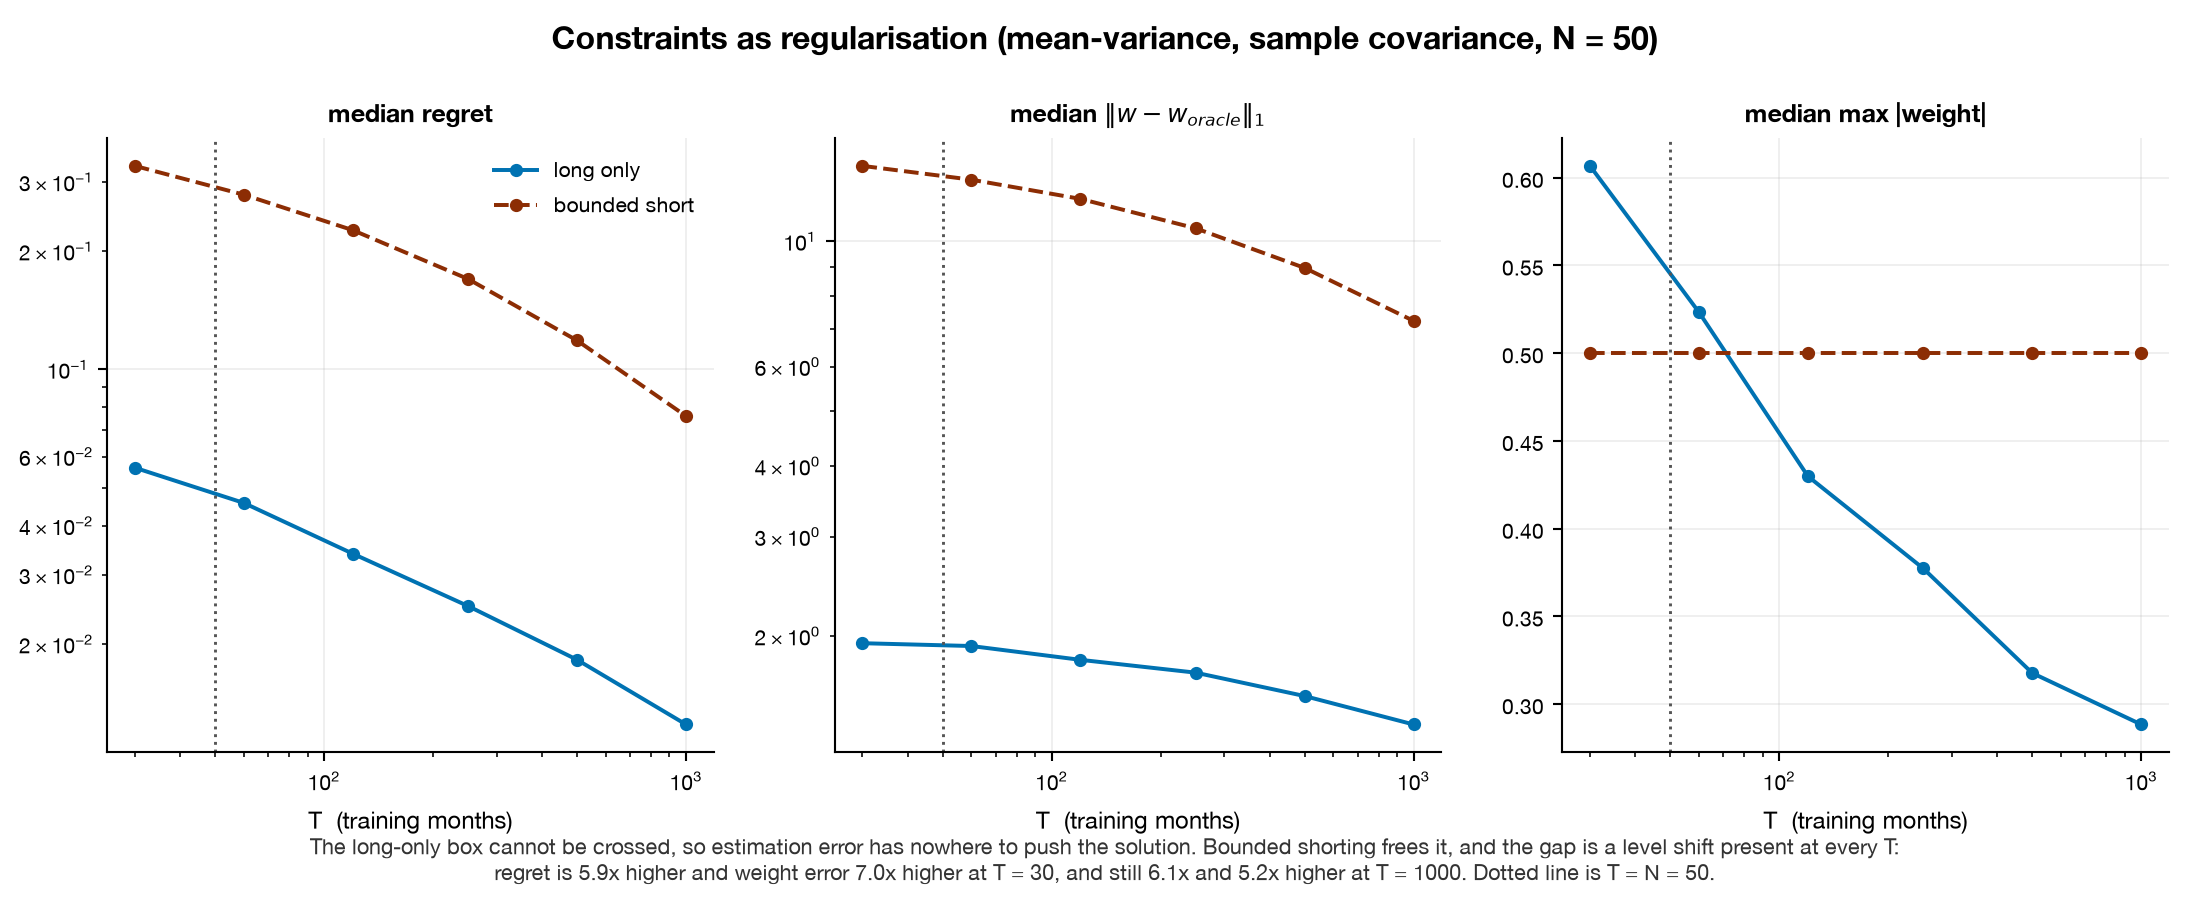
Long-only versus a modest −20%/+50% short box at N = 50, T = 30: regret 5.9× lower, weight error 7.0× lower. And with N ≥ 25 and shorting permitted, 0 of 126 optimised cells beat 1/N even half the time, at any T in the grid — while the oracle still wins 92.8–100% under those same constraints. The box does not make the problem harder to solve; it makes estimation error far more expensive by removing the wall the errors were being pressed against.

NLong-onlyBounded shorting
570.6%66.9%
1070.1%57.8%
2571.7%40.9%
5071.1%24.6%
10070.7%14.3%
P(Sharpe > 1/N) at T = 1000 — 83 years of monthly data. Identical data and estimators; only the constraint set differs.
Three panels comparing regret, weight error and maximum weight under long-only versus bounded shorting
The same optimiser under the two constraint regimes. The gap is a level shift present at every T.

The 1% idea

A nudge below the noise floor rewrites the portfolio

Rather than shocking prices, we shock the estimated inputs by amounts smaller than their own standard errors. Shifting expected returns by 50 bp per year — 18% of one standard error even at T = 1000 — produces 195% turnover under shorting versus 16% long-only, and flips the largest position 48% of the time.

Nudge (bp/yr)Long-only turnoverShorting turnoverTop position flips (shorting)
10.3%4.0%18.3%
51.6%20.0%19.3%
103.2%39.7%25.0%
258.1%98.7%32.3%
5015.7%195.4%48.0%
Response to a shift in estimated expected returns at N = 100, T = 1000 — the most data-rich cell in the grid.

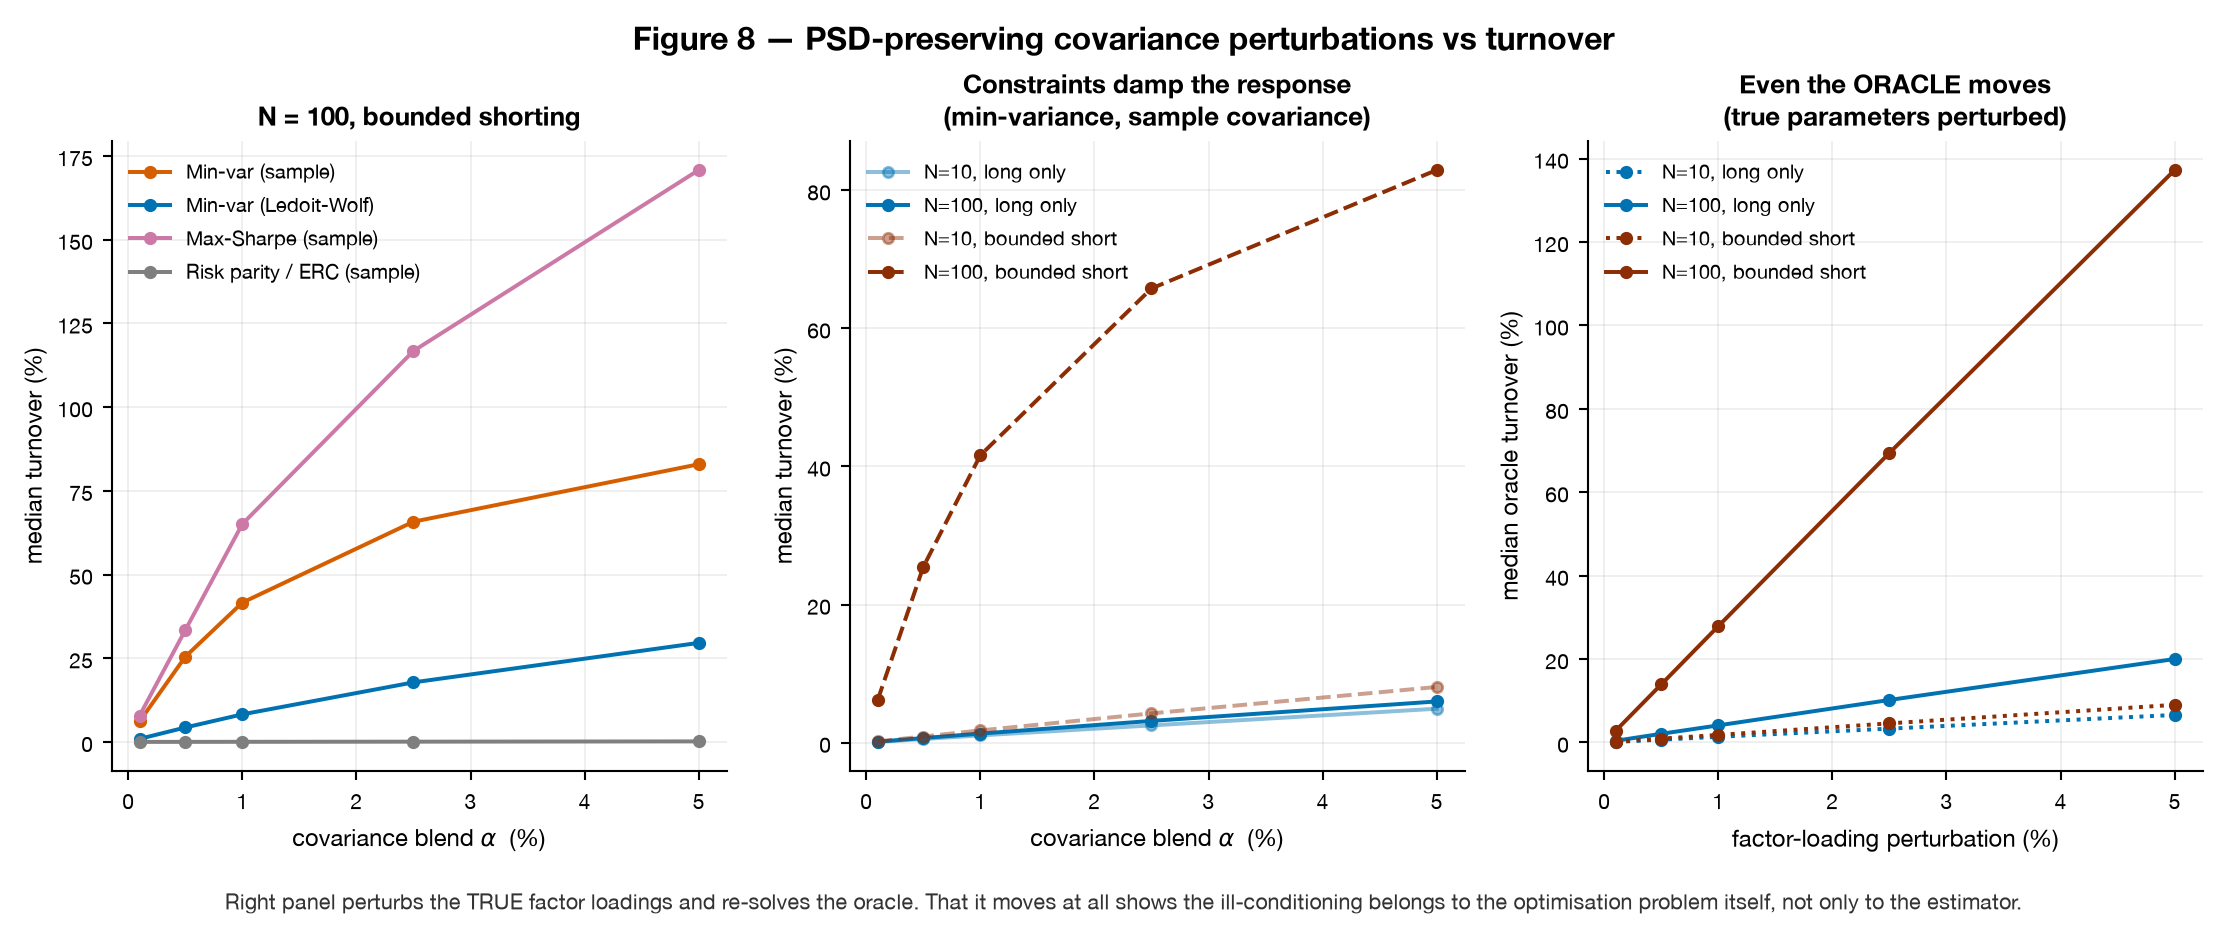
A 1% perturbation of the estimated covariance moves 490% of a maximum-Sharpe book at N = 100, T = 60. Ledoit-Wolf cuts that to 25%; the long-only constraint cuts it to 0.7%. And perturbing the true factor loadings by 1% still moves the oracle by 28% — the ill-conditioning belongs to the optimisation problem, not only to the estimator.

Three panels showing turnover caused by covariance perturbations
PSD-preserving covariance perturbations. The right panel perturbs the true parameters and re-solves the oracle.

Shrinkage

Fixing the covariance cannot fix a noisy mean

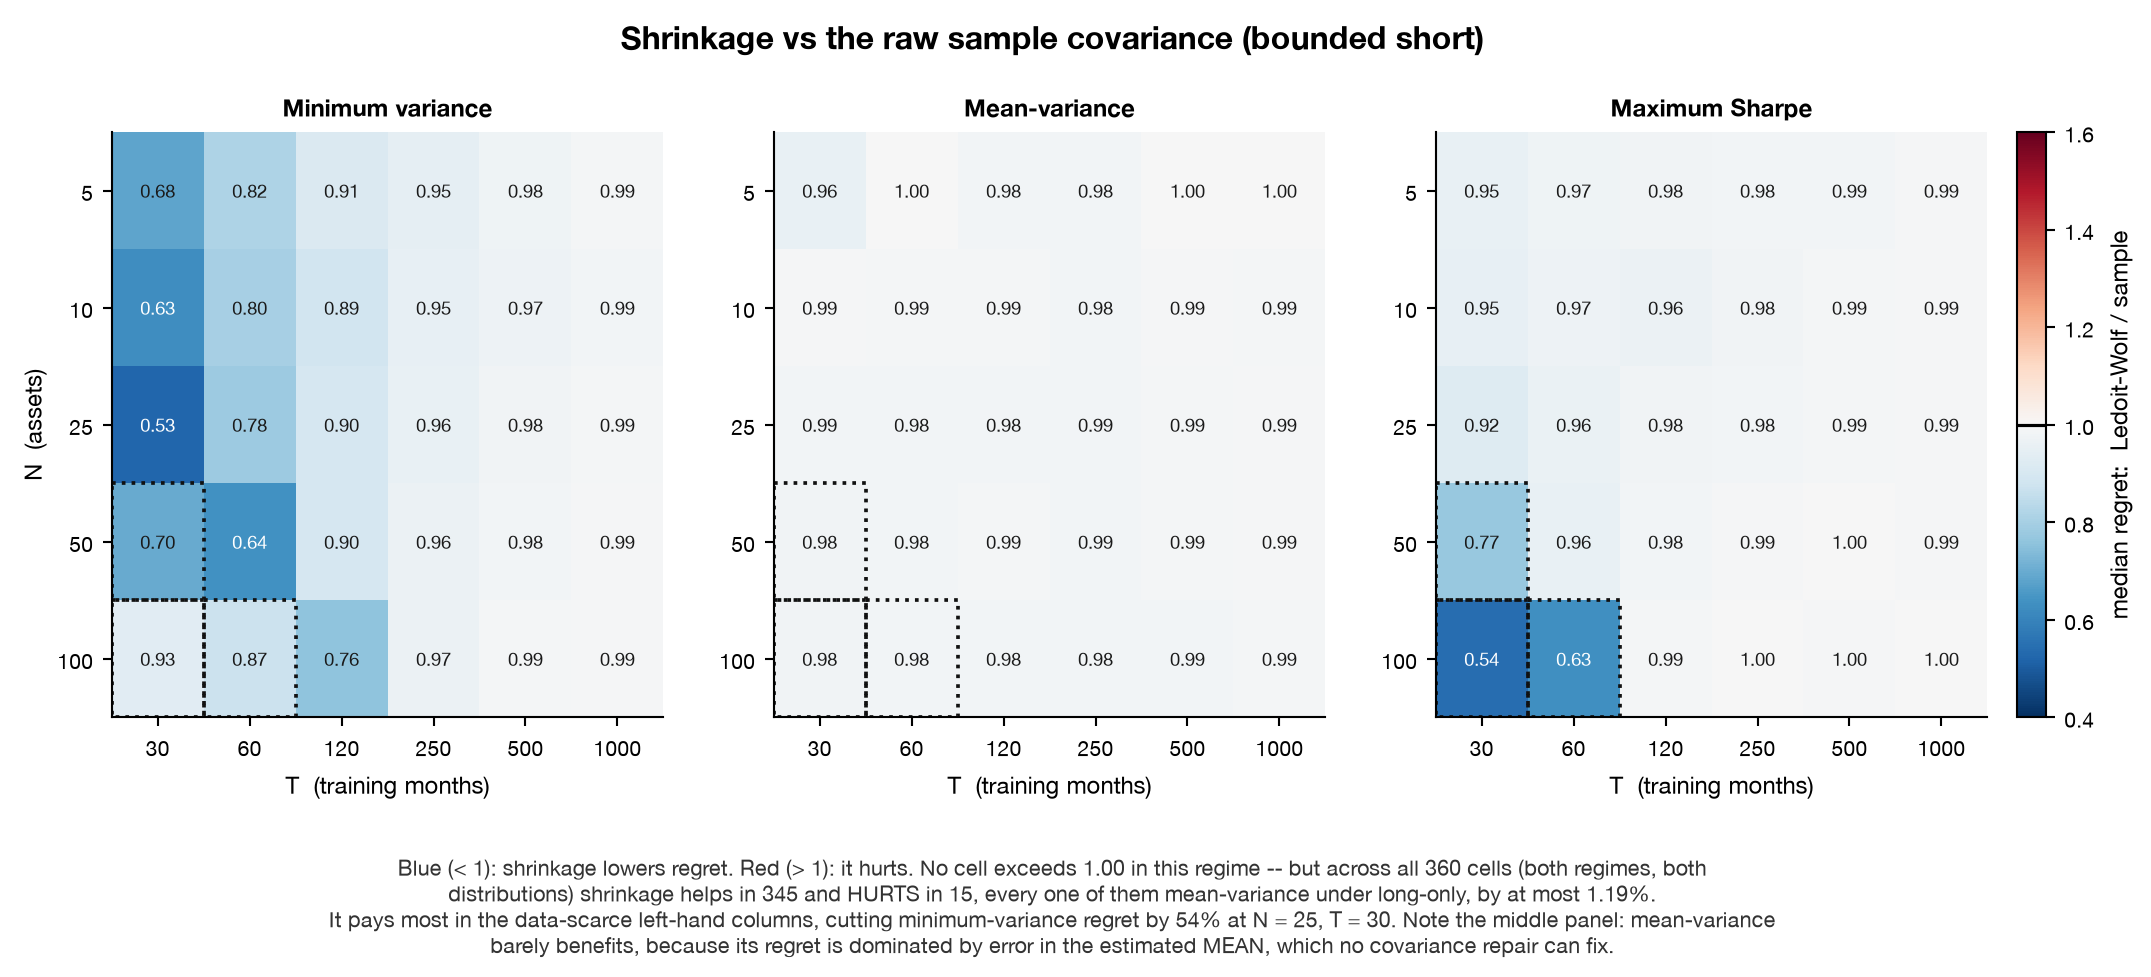
Ledoit-Wolf shrinkage is a coin flip on Frobenius error — it wins 49% of paired repetitions, because its scaled-identity target is badly misspecified against a factor-structured covariance. Yet it collapses the condition number from 1015.65 to 101.89 and lowers median regret in 345 of 360 cells, with a best case of a 54% cut.

It is not universally safe, and the exceptions are the point: the 1.2% worst degradation, and every one of the 15 cells where it hurt, is mean-variance — whose median regret ratio is 0.99. Mean-variance regret is dominated by error in the estimated mean, and no amount of covariance repair touches that.

Three heatmaps of the regret ratio between shrinkage and the sample covariance
Regret ratio, Ledoit-Wolf over sample covariance, per grid cell. Blue means shrinkage helped. The middle panel is nearly white: mean-variance barely responds.

Design

How the experiment works

Known ground truth

A four-factor model gives μ = Bμf and Σ = BΣfB⁠ᵀ + D exactly. A fresh world is drawn every repetition, so nothing is conditional on one lucky parameterisation.

Structural train/test split

World, training and test draws are separate children spawned from one SeedSequence, so no draw can leak between them. Seeding is content-addressed, so any single repetition reproduces in isolation.

An oracle that is never available

The same problem solved with the true parameters. Tests corrupt the training sample and assert the oracle does not move.

Certified optimisers

The Monte Carlo runs on a fast OSQP path; every optimiser also has a cvxpy reference implementation the test suite checks it against, so speed never costs trust.

Failures are never dropped

Of 1.32M solves, 747 were non-optimal — 704 of them maximum-Sharpe problems that are genuinely infeasible. All are persisted with their status.

Heavy tails as a control

A Student-t variant is rescaled so its population covariance is identical to the Gaussian one, isolating tail thickness from second moments.

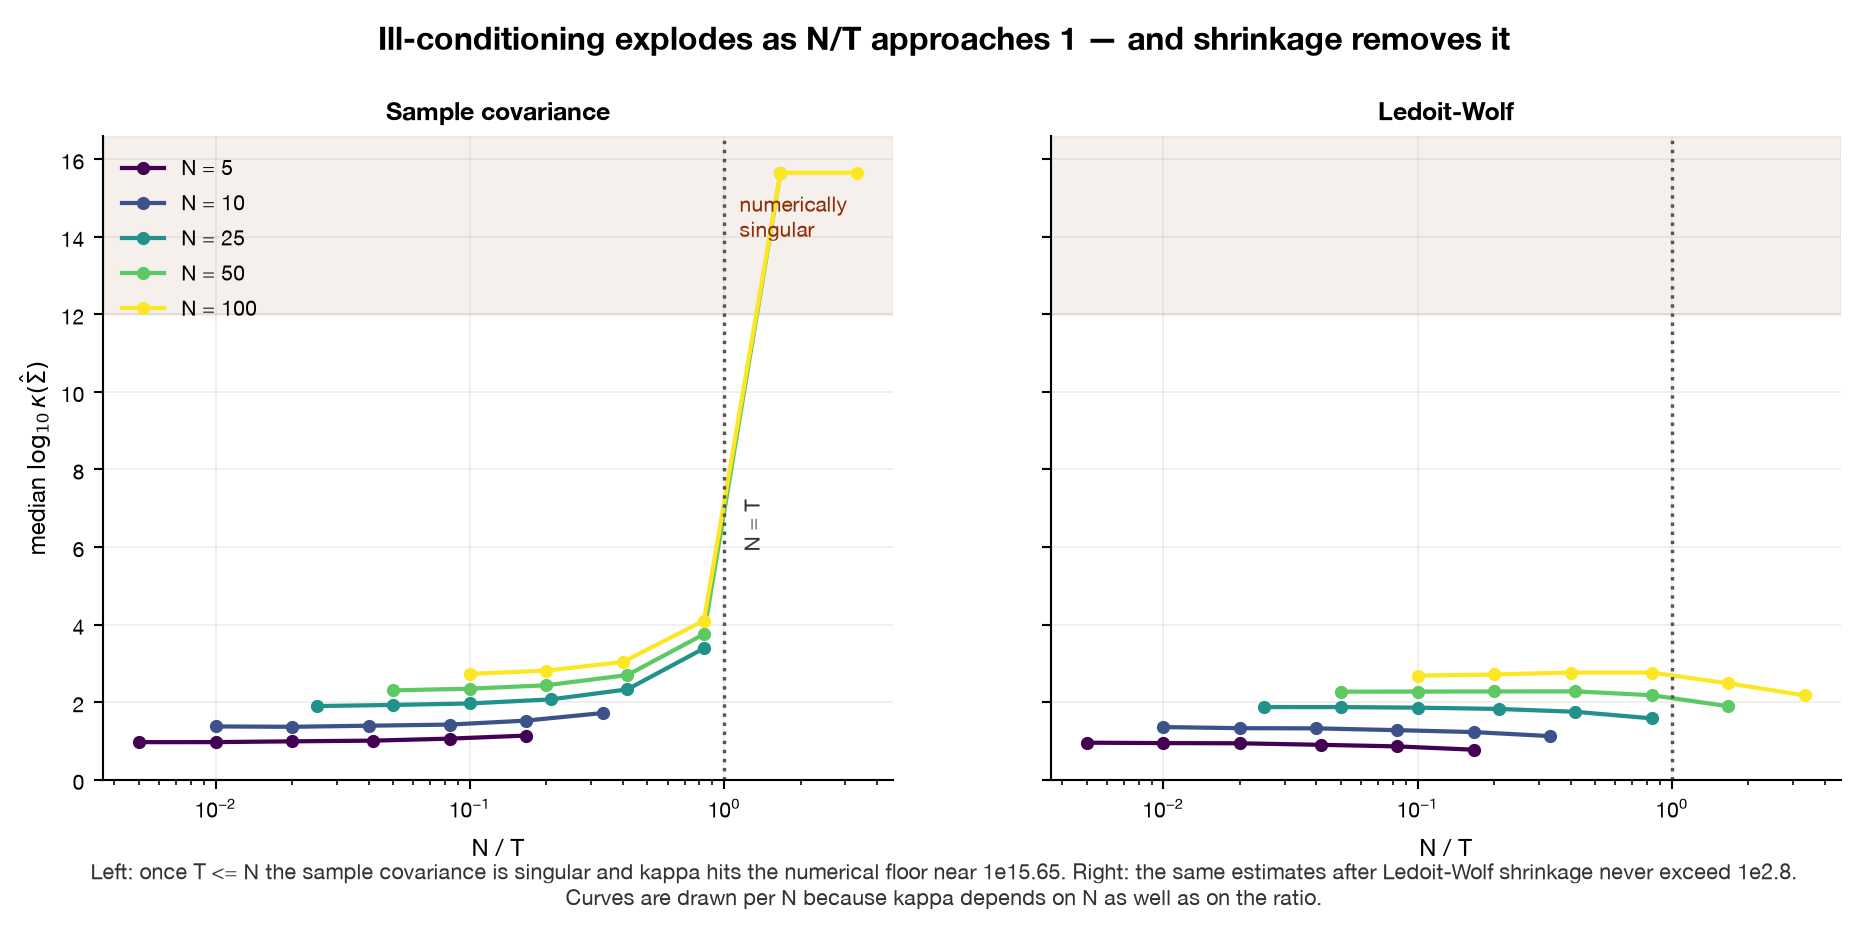
Condition number versus N over T for the sample covariance and Ledoit-Wolf
Once T ≤ N the sample covariance is singular and its condition number hits the numerical floor. Shrinkage removes the explosion entirely.

Robustness & limits

What this does not show

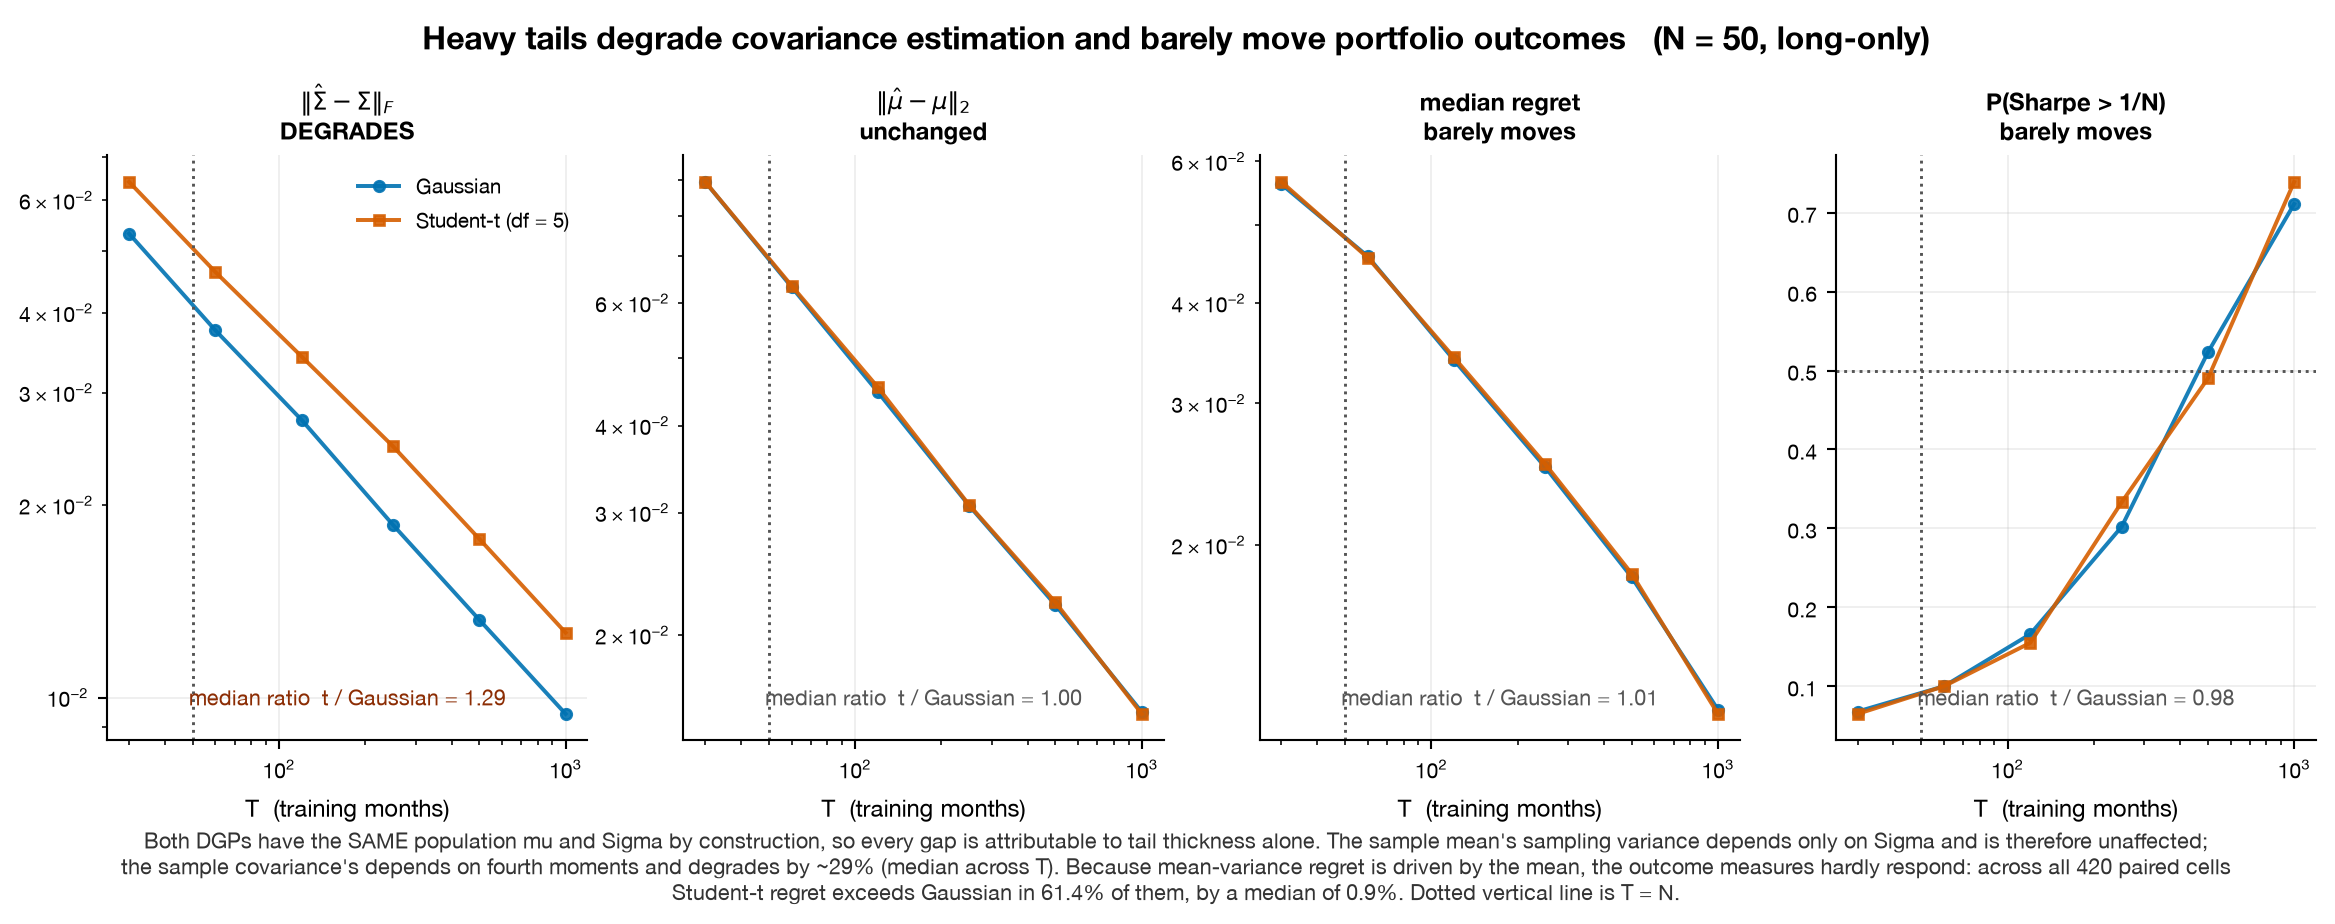
Heavy tails degrade covariance estimation by about 29% in Frobenius norm and barely move portfolio outcomes — across 420 paired cells, Student-t regret exceeds Gaussian in 61.4% of them by a median of 0.9%. The diagnosis is the mean, not the tails.

Four panels comparing Gaussian and Student-t innovations
A dissociation rather than a uniform worsening: the covariance estimate degrades, the mean estimate is untouched, and the outcomes barely respond.
The DGP is stationary and iid. Real returns have volatility clustering, time-varying correlations and regime shifts, so every result here is a lower bound on real-world instability. Only scaled-identity shrinkage targets are tested, expected returns are estimated by the sample mean (deliberately the worst reasonable choice), λ is fixed at 3, and transaction costs are absent — turnover is measured, not charged for.
A walk-forward ETF appendix exists in the report and is secondary. On real data the true parameters are unknown, there is no oracle and no regret, and it is a single historical path rather than a sample. It is a plausibility check; it cannot and does not corroborate the Monte Carlo.

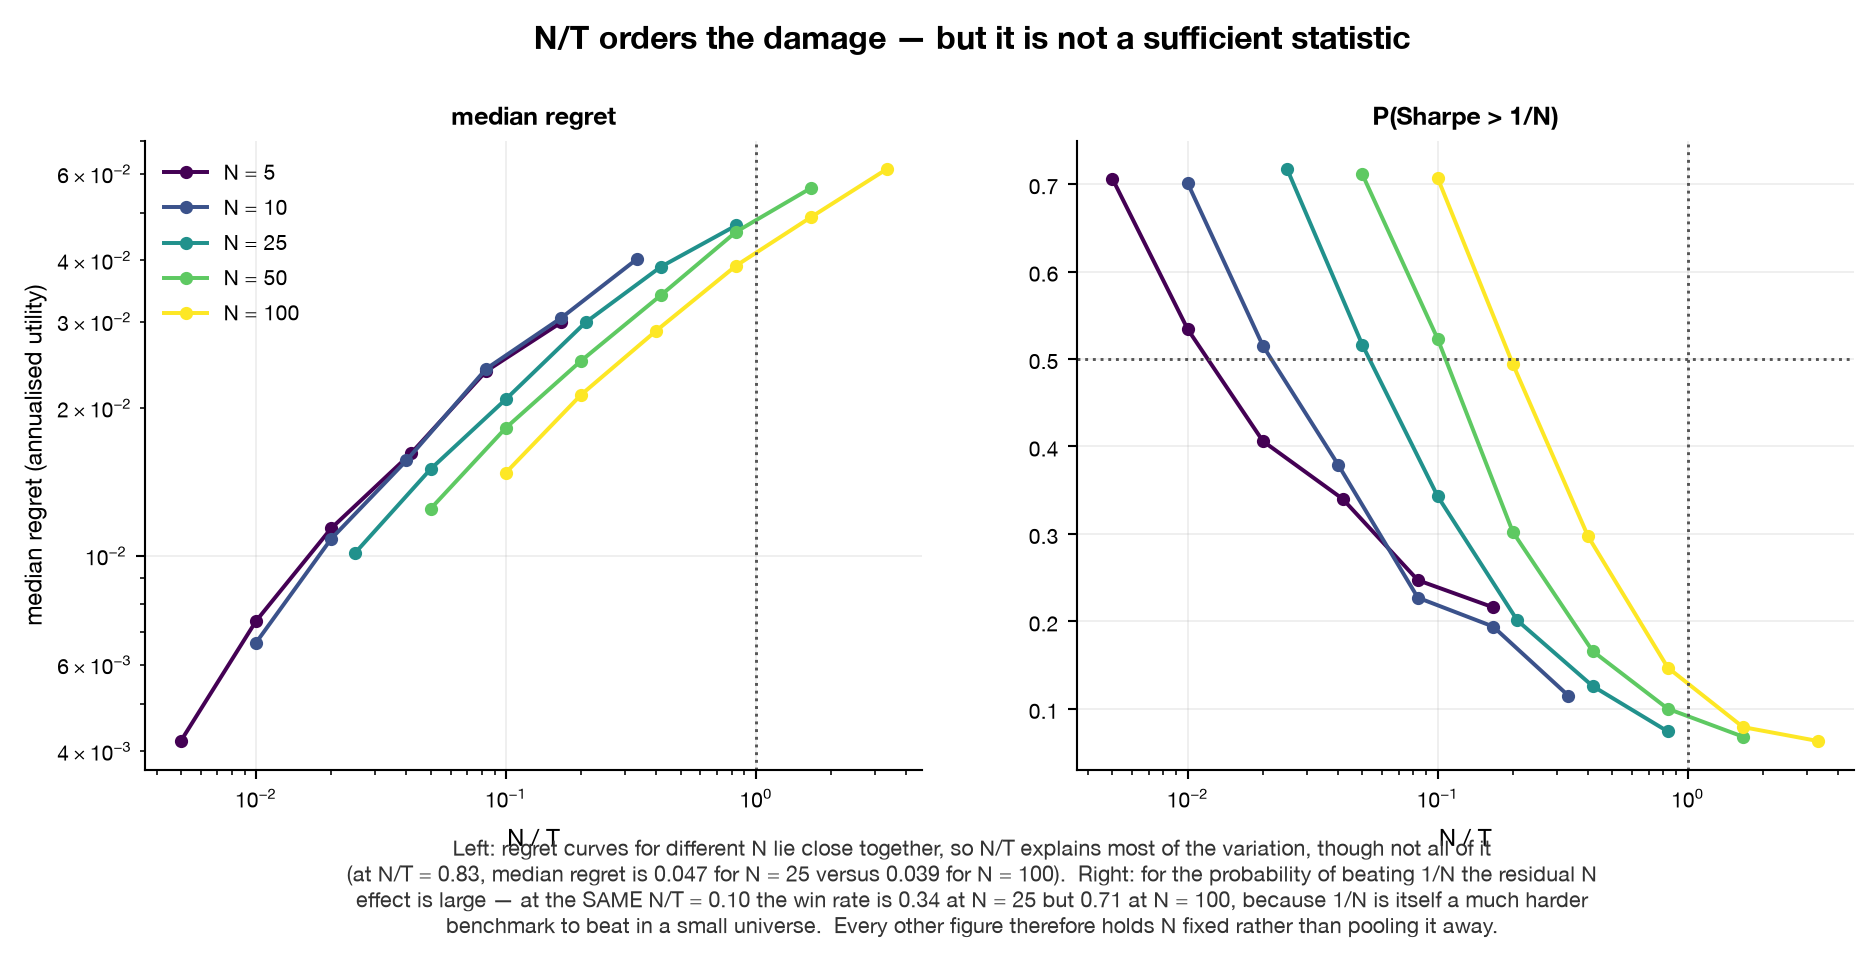
N/T orders the damage but is not a sufficient statistic: at the same N/T = 0.10 the win rate against 1/N is 0.34 at N = 25 and 0.71 at N = 100, because 1/N is a much harder benchmark to beat in a small universe.

Two panels testing whether N over T is a sufficient statistic
Regret curves for different N nearly collapse onto a function of N/T; the win rate against 1/N clearly does not.

Reproducibility

Every number here is machine-verified

The 190 MB of raw simulation output is not committed. It is reduced to a 302 KB canonical layer that is, which a four-tier verifier checks the published claims against. A fresh clone verifies everything on this page without re-running the simulation.

results/main_grid/*.parquet   [gitignored, 190 MB]
        |  scripts/build_canonical.py
        v
results/canonical/*           [tracked, 302 KB]
        |  scripts/verify_claims.py
        v
README . REPORT . this page

ARTIFACT

Published values checked against the committed canonical summaries.

RECOMPUTE

The same conclusions re-derived by a different route — from raw counts rather than stored proportions.

ANALYTIC

Mathematics needing no simulation: the standard-error annualisation, the crossover algebra, the ERC first-order condition, max-Sharpe scale invariance.

DOCUMENT

Prose checked against the artifacts via structured claim tags, so a number cannot drift unnoticed.

python -m pytest tests/ -q            # 212 tests
python scripts/verify_claims.py       # 50 claims, 4 tiers
python scripts/verify_claims.py --json